











See how beverage performance varies across concession stands, bars, clubs and suites.
Compare pour and sales data to uncover inconsistencies and recover missed revenue.
Track pours, flag exceptions and maintain greater oversight across the entire venue.
COO for fast-growing chain
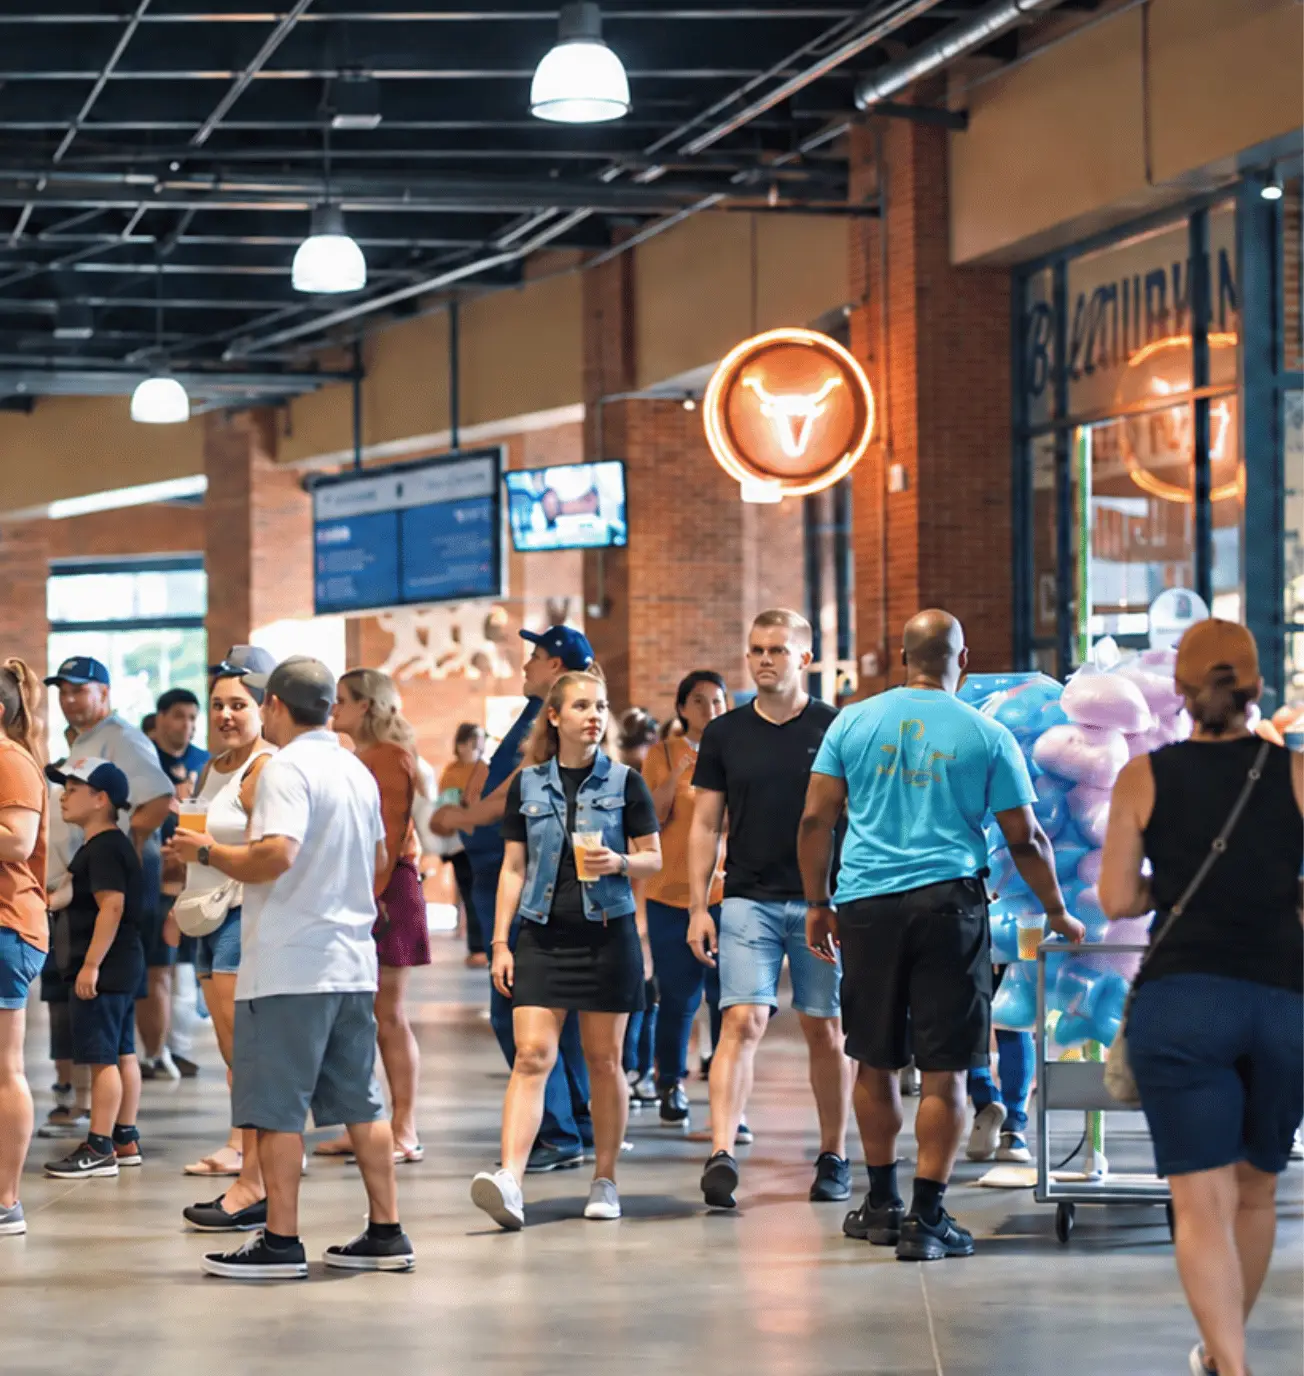
Compare beverage performance by game, concert, show, daypart, and event type for ultimate visibility.
Compare concourse bars, portable bars, clubs, suites, and stands to spot top performers and missed revenue.
See what happens during pre-game, halftime, intermission, post-show, and other peak service windows.
See pours, comps, voids, doubles, premium substitutions, and other exceptions across bars and stands.
Setup is simple and low-disruption. BarVision is designed to get locations live quickly, without major operational changes, construction, wiring, or service interruptions.
SmartSpouts connect pour data with sales activity, giving operators clear reporting by location, bar, bartender, and time period. This makes it easier to identify variances and know where to take action.
Your Customer Success Advisor works with your Revenue Champion to turn the data into clear next steps. Management acts, performance improves, and the financial impact is measured and reported.
Underpours, correct pours, and overpours all roll into one average — masking the execution drift happening pour by pour.
The POS records what was charged at the register, but not whether the drink was poured to recipe during a rush.
BarVision reveals what inventory cannot: whether every drink was poured to recipe, charged correctly, and executed as designed across every location.
BarVision is an Enterprise Beverage Performance Intelligence Platform that measures, compares and improves beverage performance across individual locations and entire portfolios.
In as little as 5 to 7 business days after you choose which bottles to cover.
SmartSpouts arrive pre-configured for your bar layout. Your team installs them in minutes — no tools, no technical knowledge, and no interruption to service.
No. There are no buttons and no measured shots. Bartenders free-pour at the same speed, with the same technique.
Pour volume, timestamp, liquor name, and overpour or underpour flags for every pour.
Yes. We often find 15% or more of doubles poured but charged as singles, and multiple drinks (often shots) poured when only some were charged.
Yes. Enterprise-level dashboards let management compare performance across locations and track changes over time.
Every client is assigned a dedicated Customer Success Advisor. Within your first week, they deliver a performance report showing where revenue was leaking.
Or call us directly at
484-730-2000


