









Enterprise revenue intelligence

First-of-Its-Kind Beverage Performance Intelligence Platform

See and compare beverage performance across every location.
Drinks Gain
additional paid drinks / bottle
0 +
Typical ROI
return on investment
8- 0 ×
Join 500+ clients from across the country.
Image gallery marquee
Actionable insight

Find and Capture More Beverage Revenue

BarVision gives enterprise hospitality operators the consolidated, location-by-location reporting they have never had — and turns that visibility into measurable revenue and ROI.

Compare Performance Across the Portfolio

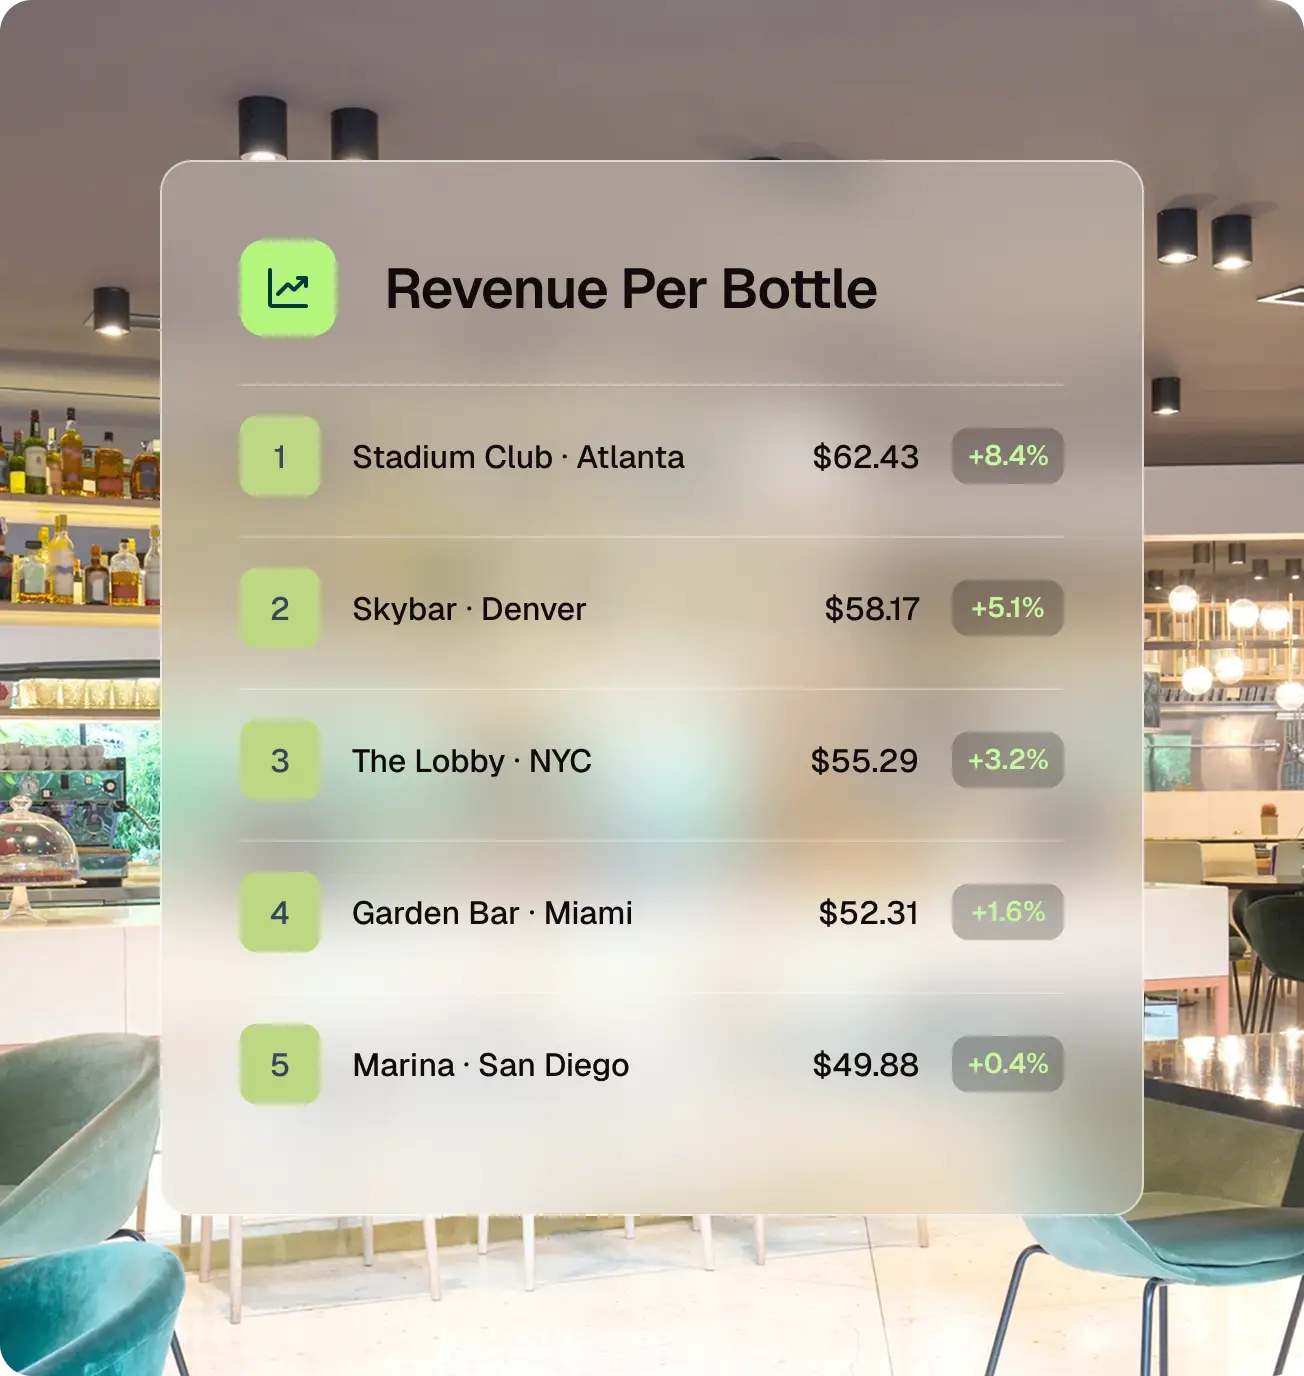
Every location on one report, ranked on the same KPIs, so leadership knows exactly where to act.

Identify Opportunities and Negative Trends

Enterprise benchmarking reveals top and bottom performers, tracks location trends.

Improve Revenue and Operating Performance

Track every pour, flag exceptions and maintain a clear compliance record across every location.

Key results at a glance

Typical ROI

8- 0 ×

Reduction in overpour frequency

~ 0 %

Additional paid drinks per bottle

0 +

Revenue gained per bottle

$ 0
Enterprise Beverage Intelligence

Metrics that Move Margin

Four pillars of intelligence - built for executives running portfolios of beverage operations.

Revenue Performance

  • Beverage revenue
  • Revenue per bottle
  • Revenue recovery opportunities

Enterprise Benchmarking

  • Locations ranked on revenue per bottle, paid drink yield, overpour frequency and average pour size
  • Highest and lowest performing locations
  • Most improved and negatively trending locations
  • Portfolio-wide comparisons

Operational Performance

  • Overpour frequency rate
  • Average pour size
  • Double posting frequency
  • Average overpour amount
  • Undercharge frequency
  • Premium posting frequency

Yield Performance

  • Paid drink yield
  • Yield by brand
  • Yield trends over time
  • Yield by bottle
  • Yield by location
BarVision report ranking revenue per bottle across locations
Enterprise benchmarking

One Reporting Standard Across Every Location

BarVision turns location-level performance into enterprise-wide intelligence, helping leaders compare results, uncover hidden gaps, and know where to act.
  • Portfolio-wide leaderboards across every metric
  • Regional and brand-level rollups
  • Most improved & negatively trending detection
Impact scenarios

The Impact Opportunity
is Tremendous

Every operation is different. Here is what visibility looks like translated into financial results across a few representative scenarios.
Our Blog

Insights & Resources

FAQ

Questions about BarVision

Have more questions? Go to the BarVision FAQ or Contact Us .

What is BarVision?

BarVision is an Enterprise Beverage Performance Intelligence Platform that measures, compares and improves beverage performance across individual locations and entire portfolios.

In as little as 5 to 7 business days after you choose which bottles to cover.

SmartSpouts arrive pre-configured for your bar layout. Your team installs them in minutes — no tools, no technical knowledge, and no interruption to service.

No. There are no buttons and no measured shots. Bartenders free-pour at the same speed, with the same technique.

Pour volume, timestamp, liquor name, and overpour or underpour flags for every pour.

Yes. We often find 15% or more of doubles poured but charged as singles, and multiple drinks (often shots) poured when only some were charged.

Yes. Enterprise-level dashboards let management compare performance across locations and track changes over time.

Every client is assigned a dedicated Customer Success Advisor. Within your first week, they deliver a performance report showing where revenue was leaking.

Turn Beverage Performance Data Into Measurable Revenue Growth

See exactly where revenue is being lost, compare financial performance across every location, and measure the ROI of every improvement.

Or call us directly at
484-730-2000